It sounds simple enough: If you ask the right question, you get the right answer. For utility fleets, according to Lanelle Duke, VP of product at industry benchmarking company Utilimarc, the best maintenance and repair metrics provide context.
“You might think your fleet is performing well, but without peer benchmarks it’s hard to know for sure,” said Duke. “When you compare your performance to similar fleets, you may find you’re ahead in some areas but falling short in others. That’s where data-driven insights become powerful.”
Asking the right questions is only part of the equation. According to Paul Milner, VP of operations at Utilimarc, high-quality, accurate data is just as critical. “Data can be a barrier to analytics,” Milner explained. “If your datasets aren’t reliable, they can’t be used to generate insights or deliver true business value.”
A key issue, he explained, is the continued use of outdated or disconnected systems for tracking maintenance and repair activity. “When data lives in silos or is captured inconsistently, errors creep in and those errors undermine trust in the entire dataset,” Milner said. “Accurate reporting starts with consistent, dependable data.”
Milner emphasized that data quality begins with integration. “Bringing all your data sources under one roof makes it much easier to manage,” he said. “For larger fleets with a wide variety of assets, this level of centralization isn’t just helpful, it’s essential.”
With systems unified, the next step is validation. “You need confidence that what you’re looking at reflects reality,” Milner added. “Cross-referencing data points can quickly flag inconsistencies, while simple checks and test metrics help ensure accurate entry at the source.”
Eye Opening Insights
“Having access to industry context is truly eye-opening,” Duke said. “When you can see what best-in-class fleets are doing, it highlights best practices and sparks meaningful changes within your own operation.”
Utilimarc’s approach to benchmarking enables utility fleets to assess their performance in a highly granular way— by fleet size, region, vehicle class, or other relevant dimensions— while also comparing against broader industry averages.
“An accurate, peer-to-peer benchmark helps you understand exactly where you stand,” Milner related. “It’s not just about meeting industry norms it’s about revealing opportunities to improve.”
According to Milner, benchmarking insights can be applied across all facets of fleet operations, from shop productivity to vehicle utilization. Key benefits include:
Benchmarking metrics provide a clear path to making decisions about maintenance and repair activities that improve performance and reduce downtime, Duke noted. Fleets see how they stack up against other operations in a very granular way as well as compared to industry averages.
Benchmarking Value
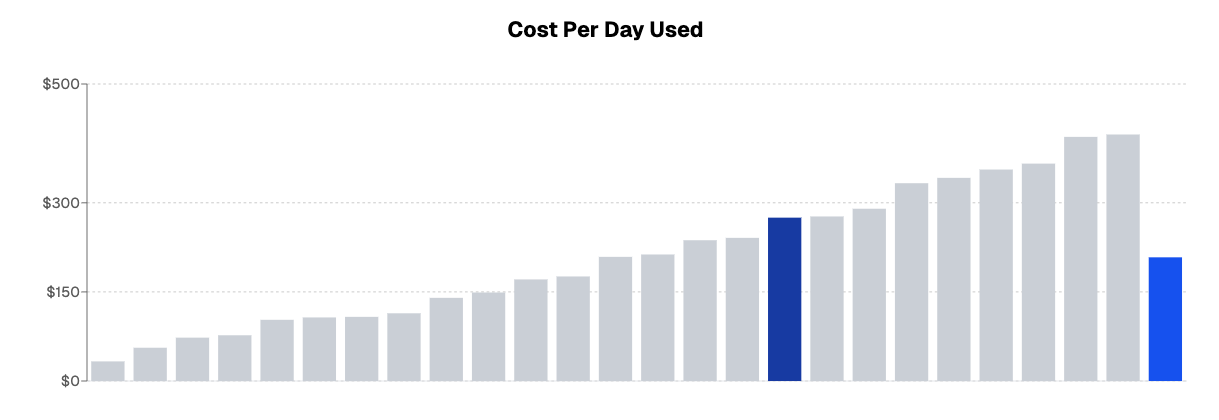
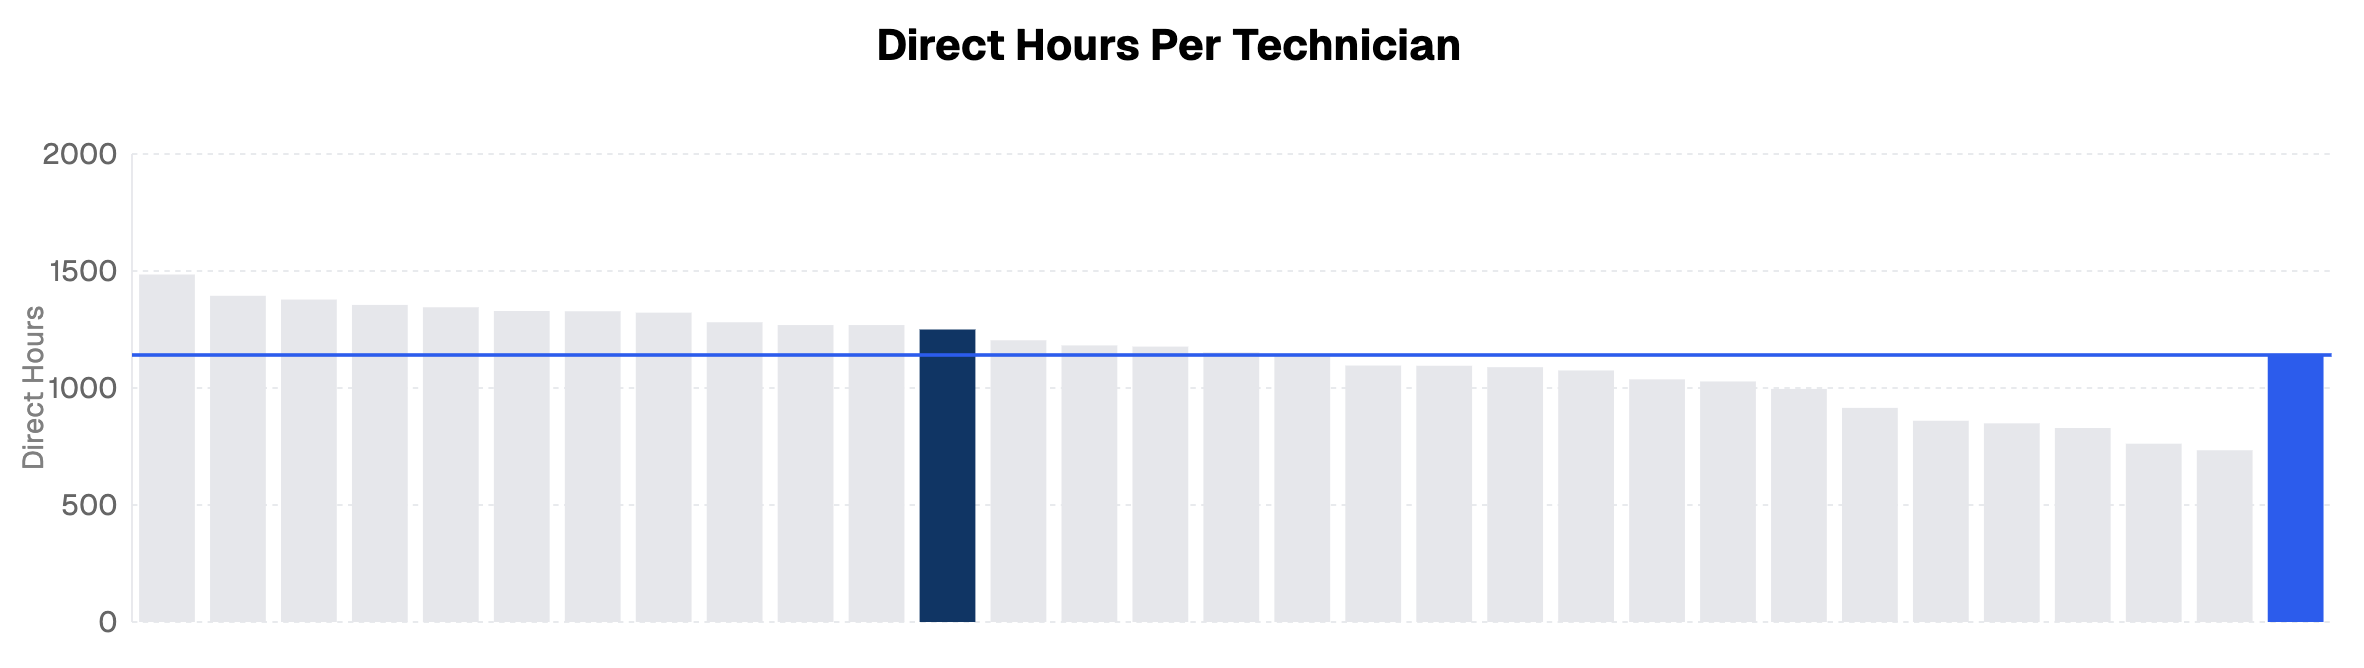
“The ability to view technician productivity through the lens of a benchmark highlights its true value,” Milner said. “By analyzing your maintenance program, whether it’s in-house, outsourced or a mix or practices, you gain a clear picture of shop throughput and technician efficiency.”
Milner offered a common example: For a full-time technician working 2,080 hours annually, the industry benchmark is around 1,500 direct labor hours, defined as time spent actively working on a repair order. “If your fleet is falling below that threshold, the benchmark becomes a diagnostic tool,” he explained. “It could indicate an issue with time tracking, a productivity gap, or something more nuanced, like experienced staff taking on mentoring roles, which naturally increases indirect labor hours.”
“Benchmarks aren’t just about identifying problems, they’re about enabling progress,” Duke added. “They help you spot long-term trends and make short-term adjustments. It all starts with accurate data and meaningful measures that give you the confidence to make smart decisions and drive continuous improvement.”
May 01, 2025

Lift & Access is part of the Catalyst Communications Network publication family.